- Get Started
- Dashboard
- Block Configuration
- Dashboard
- Widget
- Widgets/Tiles Actions
- Tiles
- Switch Roles
- Switch Dashboards
- Duration Filter
- Role-wise Dashboards
- Configuration
- Report Page Overview
- Design Reports
- Columns & Filters
- Calculations
- Ordering
- Enable Exports
- Conditions
- Permissions
- Schedule Report
- Graphs
- Jump to Another Report
- Duration Filter
- Reports
- Statistic Reports
- Course Summary
- Learner's Summary
- Graded Activity Information
- Quiz Overview
- Assignment Report
- SCORM Report
- Resources
- Learners Activity Summary
- Learner Course Activities
- Learner Quizzes
- My Quizzes
- Learner Assignments
- My Assignments
- Learner SCORM’s Overview
- My SCORM
- Learner Resources
- Enrolled Courses
- Badge Summary
- My Badges
- Section Wise Learner Performance
- Learner Activity Grade
- Competency Completion
- Site Level User Timespent
- Content Page Average Timespent
- Resource Accessed
- User Timespent
- User Profile
- Course Profile
- SQL Reports
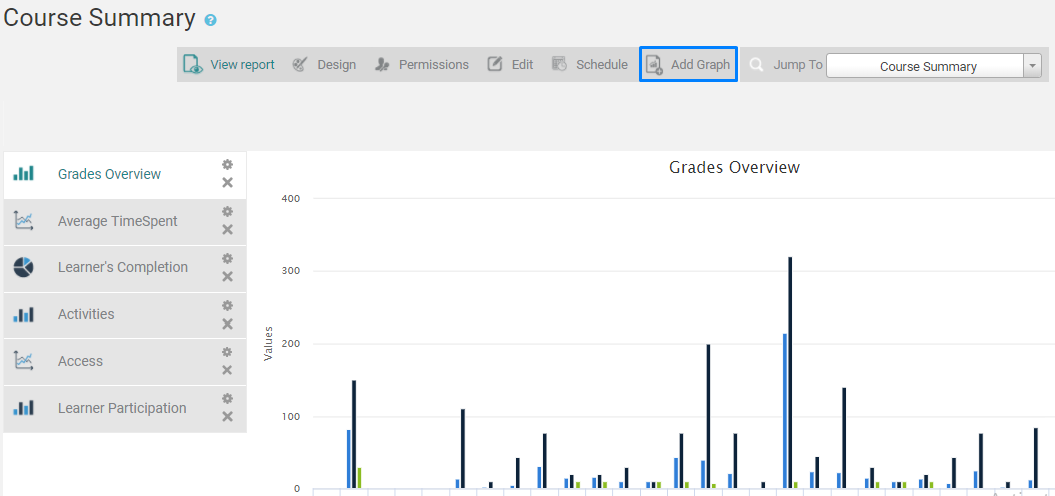
Graphs
Graphs tab helps the user to configure the chart or graph type and allows the user to customize and configure the axis for the same.
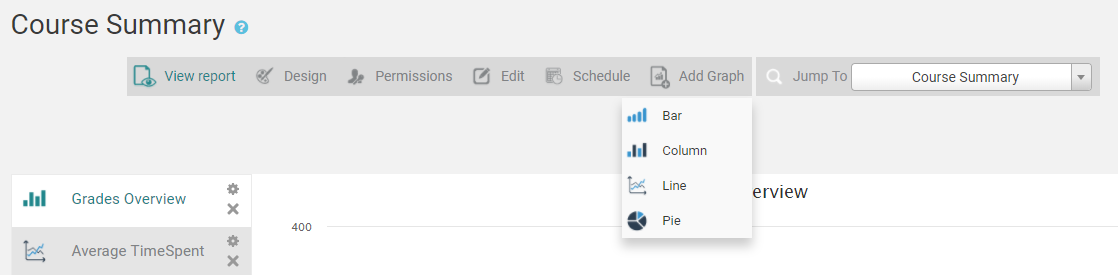
- Click on the Add Graph.
- Choose Graph Type from the drop-down list
- Enter the Chart Name(Mandatory)
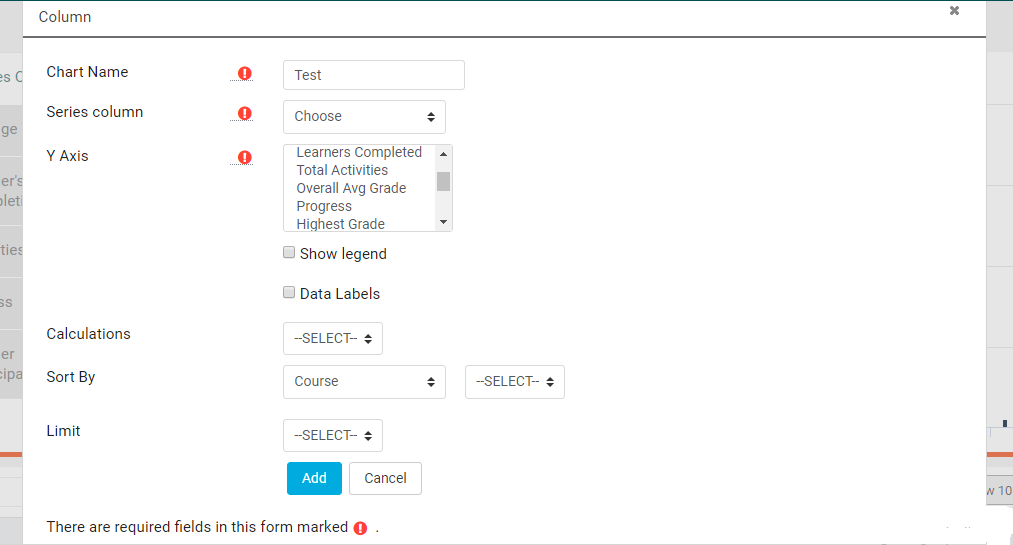
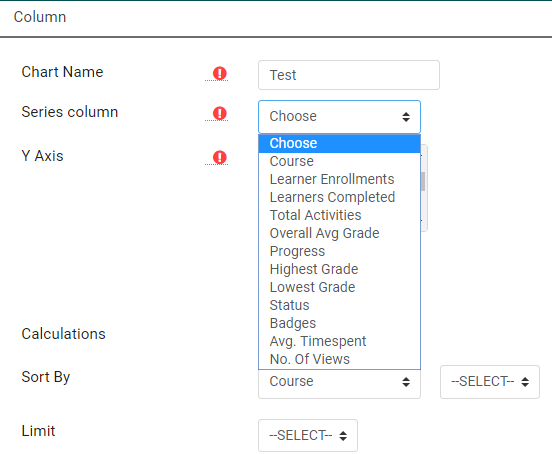
- Choose Series Column from the drop-down
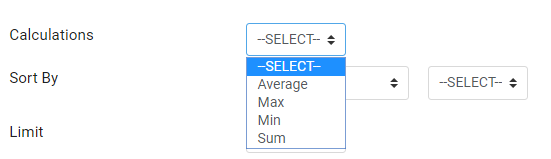
- Select the Calculations from the drop-down option of calculation field
NOTE: Y-Axis field options are different depending on the graph you choose.

