In one of the previous blogs, we’ve seen the useful Moodle statistics reports for the student role. In this post, we’ll talk about the Moodle statistics reports for the teacher role. These reports act like the billboards to the teacher, but on his dashboard, as he/she moves through it.
By the way, some of these Moodle reports are common by name. But you can understand them from the perspective of the Moodle role within the context. That is, the teacher role has to understand from its perspective, and so has the student role, on their Moodle LMS.
Let’s move to the Moodle statistics reports in detail.
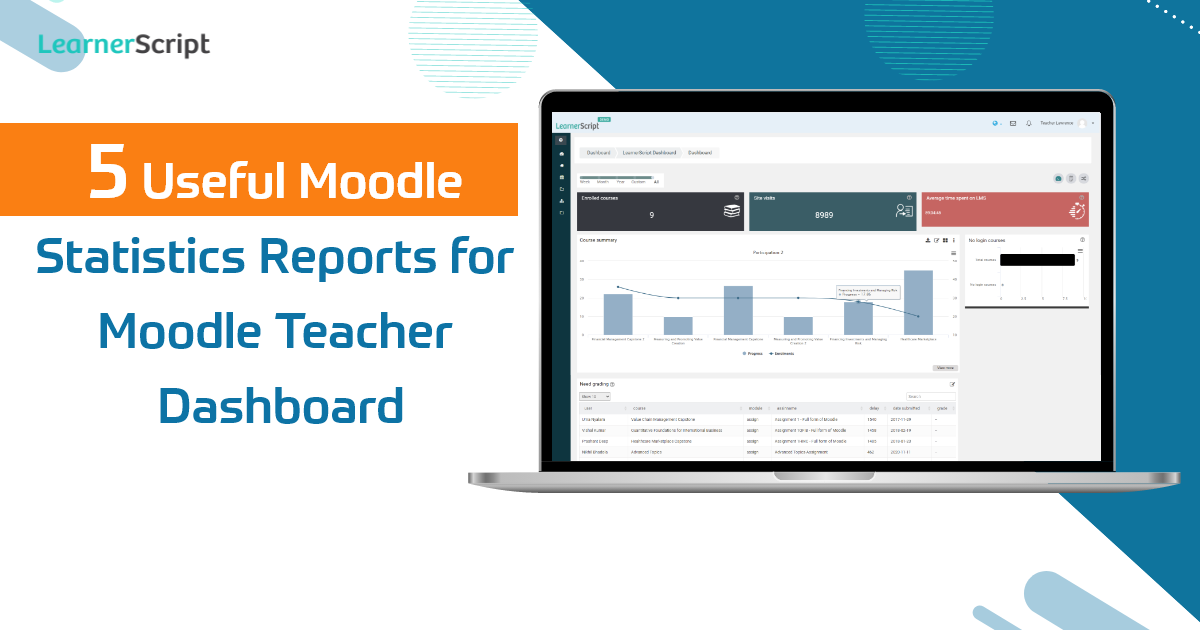
#1. Enrolled Courses
The name of this statistics report suggests that it presents the number of courses a teacher enrolled to teach. In the higher education setup, it will show the courses taken up by a professor by semester-wise.
It is one of the common Moodle statistics reports for the Moodle teacher role. Or for that matter, it’s common for the student role as well.
On LearnerScript, you can customize the Moodle statistics report colour scheme and icons as per your needs.
#2. No Login Courses
The name tells you all about this Moodle statistics report. It showcases the number of courses on Moodle not started yet by your teacher or trainer. It will display you the count of ‘No login courses’ against the count of ‘Total courses’ by a teacher or a trainer.
This Moodle report helps a teacher to take cognizance of his ‘No login courses.’So, it will help him plan his course of action accordingly.
#3. Site Visits
This Moodle statistics report reveals the number of times a teacher visits his Moodle site. The more the number of site visits means the more engaged the teacher is. It means the engagement involves active participation. And it should be so.
Customize this Moodle statistics report (which is called a tile) on LearnerScript. Visit the demo site of that Moodle reporting tool for more information.
#4. Average Time Spent on the LMS
Are the site visits enough to measure the engagement of a teacher? Certainly, not! So we have the ‘Average Time Spent on the LMS’ report. Hence this Moodle statistics report proves that the number of ‘Site visits’ is worthy for a good reason in general.
Sometimes it may not be true. A few visits to your Moodle site may result in more ‘Average time spent on the LMS.’ So you need to take the ‘Site visits’ into consideration to understand this metric.
Create such more interesting Moodle statistics reports at LearnerScript.
#5. Activity Report
Teachers create a range of activities throughout their training or teaching through your Moodle LMS. As you know a course consists of lessons, assignments, quizzes, and more.
So have the count of those activities as statistics report. For more clarity on activities statistics, it’s possible to have ‘Assignment Report’, ‘Quiz Report’, and many more such reports.
That’s all about the Moodle statistics reports useful for teachers on Moodle. Try as many Moodle reports as possible according to your need. Or teachers can create such Moodle reports as necessary for them.
Check out LearnerScript, the helpful, advanced Moodle reporting plugin. And ask us for a personal demo if you need more information.


