There are many Moodle reports on LearnerScript, which come in handy and are helpful to the default roles on the plain Moodle LMS. In the previous blogs, we have introduced some of those reports. In this blog post, we would like to talk about some simple yet useful Moodle statistics reports to your learners.
On LearnerScript, we simply call them ‘Tiles.’ They present some quick information to the Moodle student who logins to their dashboard. In other words, these reports throw some light on his learning experiences.
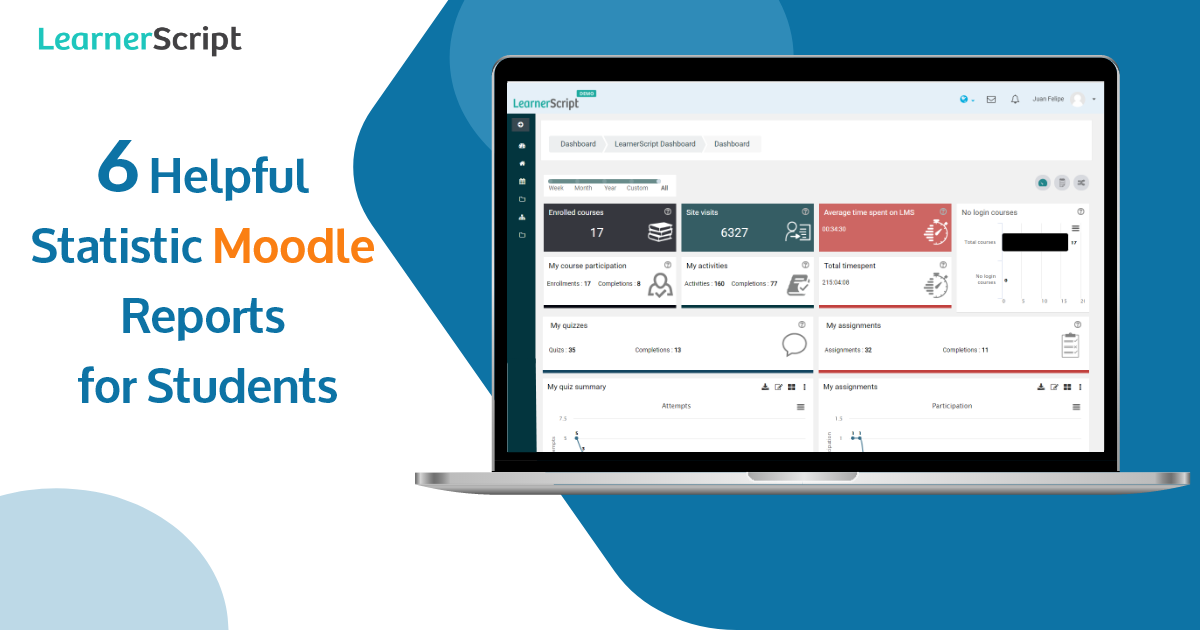
So in this blog post, we will discuss ‘6 helpful Moodle statistics reports’ for the student role.
#1. Enrolled Courses
This tile/statistics report gives the count of total enrolled courses by the student. He can see his course participation from the same report.
The intention to have this Moodle statistics report is to make the student aware of his enrolment in various courses. Moreover, he will come to know his learning progress from the count of enrolled courses and from the completed courses.
Overall, this report helps a Moodle student to gauge his learning ability in finishing up their enrolled courses.
#2. No Login Courses
The aim of this Moodle statistics report is to show your learner that he has not logged in yet to so and so(number of) courses. Your student can notice this tile in visual presentation with “Total enrolled courses” and “No login courses” yet.
This tile report will act as a notice or a reminder about the ‘no login courses’ to your student. Additionally, LearnerScript gives a provision to download this Moodle report by the student.
Check out the demo website of LearnerScript to know more about the report.
#3. Site Visits
The objective behind the statistics report is to figure out how frequently your student visits the learning management system (LMS). The number on the tile report speaks all about that.
The more number of visits implies the interest of the Moodle student role to finish up his courses. On the other hand, the less number of visits drops a hint about the student’s irregular learning progress and the chances of dropping out altogether.
How come?
This same statistics report lists two more factors to understand the learning experience – the total activities and the completed ones. Is it not sufficient to understand the student’s progress from the completed activities of the total ones?
These total activities will be updated according to the courses the student enrolled to from time to time.
#4. Average Time-spent
The average time-spent metric depicts the amount of time spent by your student. The ‘site visits’, which is just above the statistics report, tell your student how many times he visited the LMS. But this report shows him the average amount of time he spends overall on his activities.
Plus, there is another metric shown on the same report tile, the total time-spent. These time metrics are calculated from the time LearnerScript is installed on your Moodle LMS.
Ultimately, the time-spent metric becomes a deciding factor in assessing the learning progress of your student.
#5. My Quizzes
The tile reports the learning analytics related to the quizzes on the courses enrolled by the Moodle students.
Again, it makes a comparison-kind of things about the quizzes – total quizzes across the enrolled courses and the completed ones – to the student.
Overall, the student will come to know his ability in completing those quizzes or leaving them unattempted.
#6 My Assignments
The purpose of this Moodle statistics report is to make your student aware of his learning ability in finishing up his assignments.
The static Moodle report is similar to ‘My Quizzes.’ The only change here is the title of the report. Since assignments play a crucial role in the learning process of a Moodle student, this report becomes useful.
Under ‘My Assignments’ the student will have these two metrics: total assignments and completed ones. The total assignments are from across all the courses. So are the completed ones.
So these are the six Moodle statistics reports in general. However, customize any of these reports or create a new one on LearnerScript. Because this Moodle analytics plugin is such a custom-friendly one for Moodle users.
Get more information by visiting the website or by scheduling a personal demo.