Moodle Learning Management System (Moodle LMS), as you may know, is a well-known custom-friendly eLearning platform. You can custom-build it in whatever way your organization’s needs are fulfilled. Similarly, if a Moodle analytics tool is also custom-friendly, then it will make a great combination for eLearning through Moodle platform.
In this simple blog post, let’s try to understand what it means to have a ‘Custom Moodle Analytics Tool.’
We figure out that there are six key customization areas, which a Moodle reporting tool should offer to be custom-friendly. Depending upon your interest, you customize some or all of these to showcase the mark of your branding.
Let’s see one by one.
#1. Colors
Colors matter to bring awareness about your organization/product among audiences. Your color scheme will make a mark on the minds of users and hence are useful to distinguish yours from the rest of others – in any way.
So, any Moodle analytics tool that wants to be a custom-friendly tool, it must allow changing the color scheme as per the interest of your organization. These changes in the color scheme will be visible on their Moodle reporting.
LearnerScript the Moodle analytics tool allows you to modify all this stuff on it. It empowers Moodle educators to make their respective branding statements visible.
#2. Reports & Tiles
Moodle reports & tiles are another areas where the customization should be possible – either by Moodle analytics vendor or by the tech team available at your end.
The Moodle reporting customization differs from organization to organization. You may want to change the colors inside the reports. Or change the names of existing columns and add to/remove from the existing columns. Like that, there is a whole lot of things to customize if you require.
Speaking about these changes done using LearnerScript, all customization is possible here: from colors to calculations to columns to custom Moodle report building. Those who are interested can check out the demo sites of LearnerScript. Or ask us for a personal demo of this Moodle analytics plugin.
#3. Roles
By default, Moodle offers three roles: Admin. Teacher and Student. But what if you want to add more custom roles? So the learning analytics tool should accommodate to customize it for adding new roles as and when required.
LearnerScript goes beyond that basic roles stuff. You can create as many roles as you require. That said, it comes with the basic roles of Moodle platform by default. You can customize the tool for including more roles from a department or organization.
Check out the demo site of LearnerScript for more information.
#4. Graphs & Charts
LearnerScript offers various graphs & charts, other than tables. Depending on your Moodle reporting need, add a graph or chart to the table. As mentioned earlier, the customization of various aspects is possible.
If it is required, we can add a different kind of graph to the existing list of them. Check the demo site of LearnerScript to see and to know more about it.
By the way, to the custom Moodle report you create, you can add any graph or chart or simply keep it as a table.
#5. Custom Dashboards
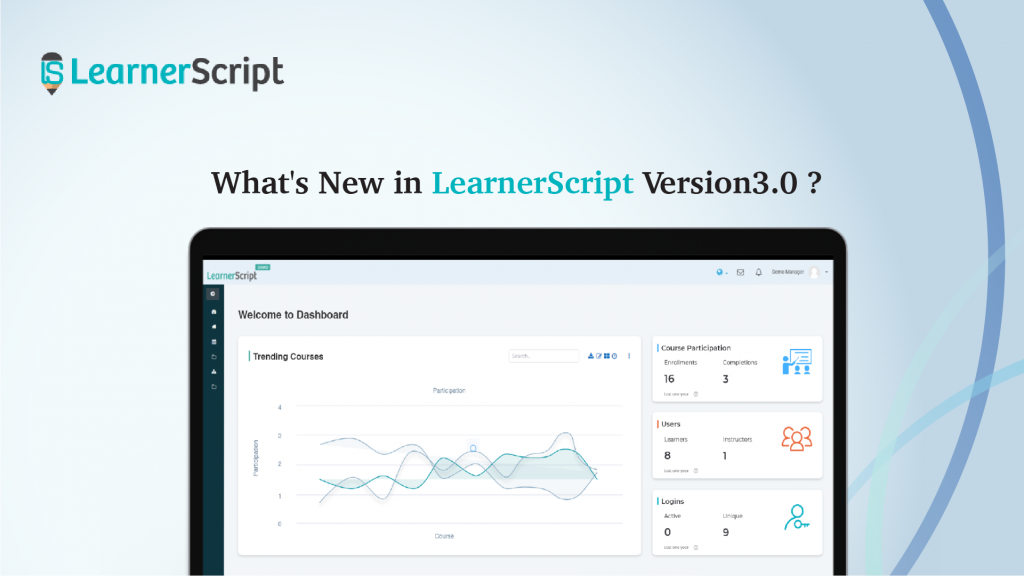
All of the above customizations culminate into a custom Moodle dashboard.
The question here is, will a Moodle analytics tool provide them all? Or in other words, will it give complete control over the tool?
Yes, LearnerScript does.
With LearnerScript, you can create a number of role-wise multiple dashboards and place the Moodle reports in an order of visibility-importance on the dashboard.
Check out LearnerScript today for more information and ask us for a personal demo if you see this Moodle analytics tool interesting.

