You might know through social media channels that we launched LearnerScript last week. In this blog, we take you to how to get started with this advanced analytics tool for Moodle platform.
Here we go…
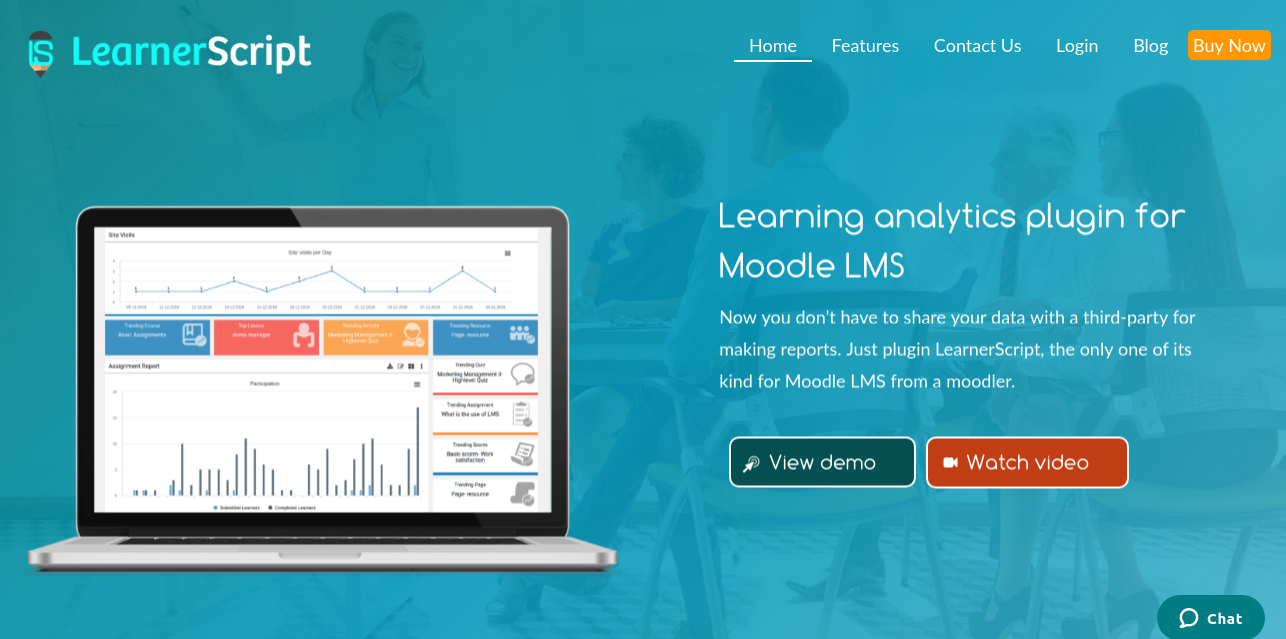
In order that you take the demo of this Moodle plugin, click on the tab “View demo” on the homepage banner. Have a look at the image below for clarity.
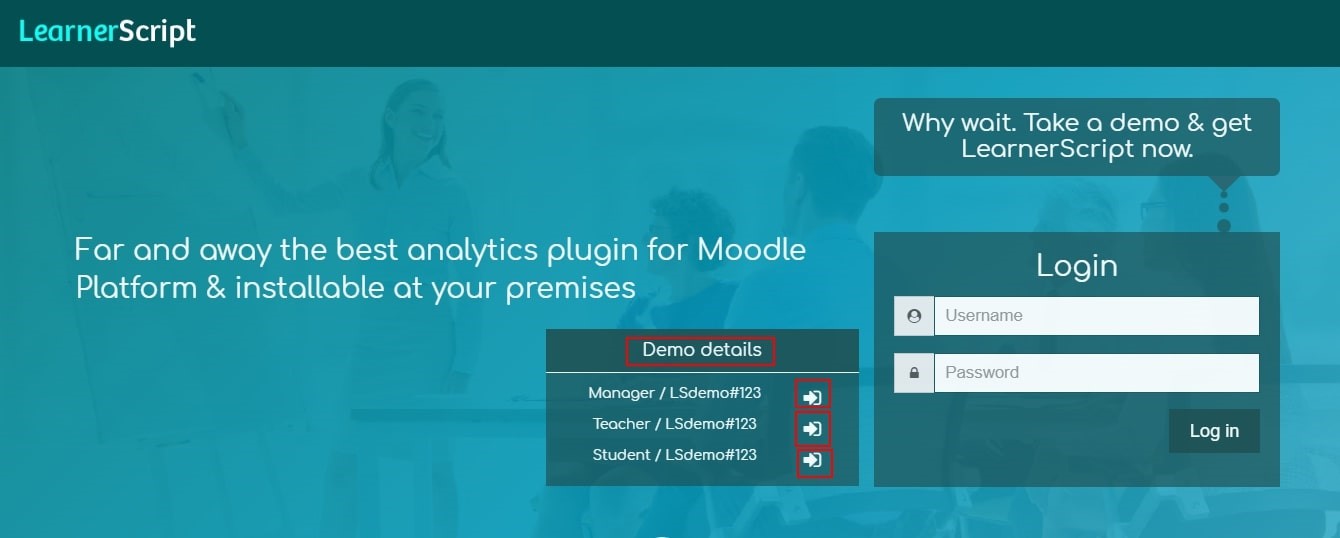
Once you click on the tab and are in the demo page, you get to see the demo details for three different roles:
- Manager
- Teacher
- Student
When you click on the respective arrow, you will be taken to that Moodle role-related dashboard/page.
Now, let’s have a closer look at each role’s demo site.
Manager Role
Before logging into the role, have this clarity: Manager here is Moodle LMS admin, be it in Corporates, K-12 or Higher Edu. She will have complete access to all Moodle analytics from the LMS data.
Take a look at the page.
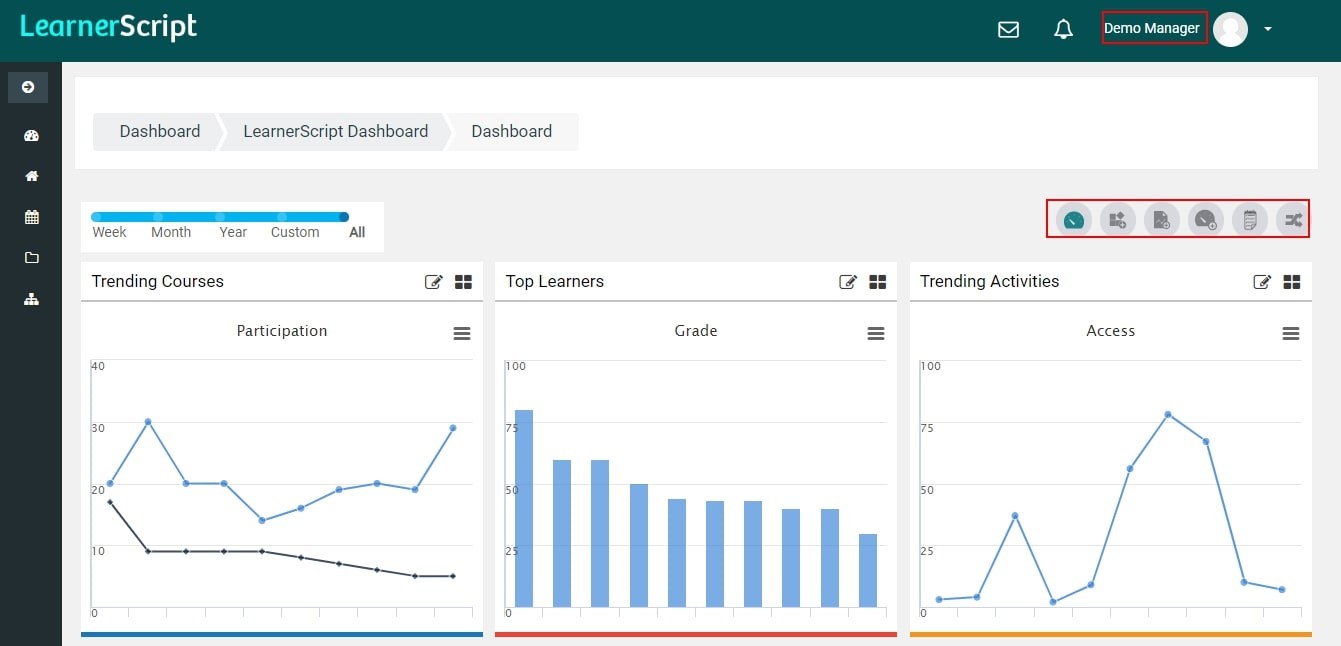
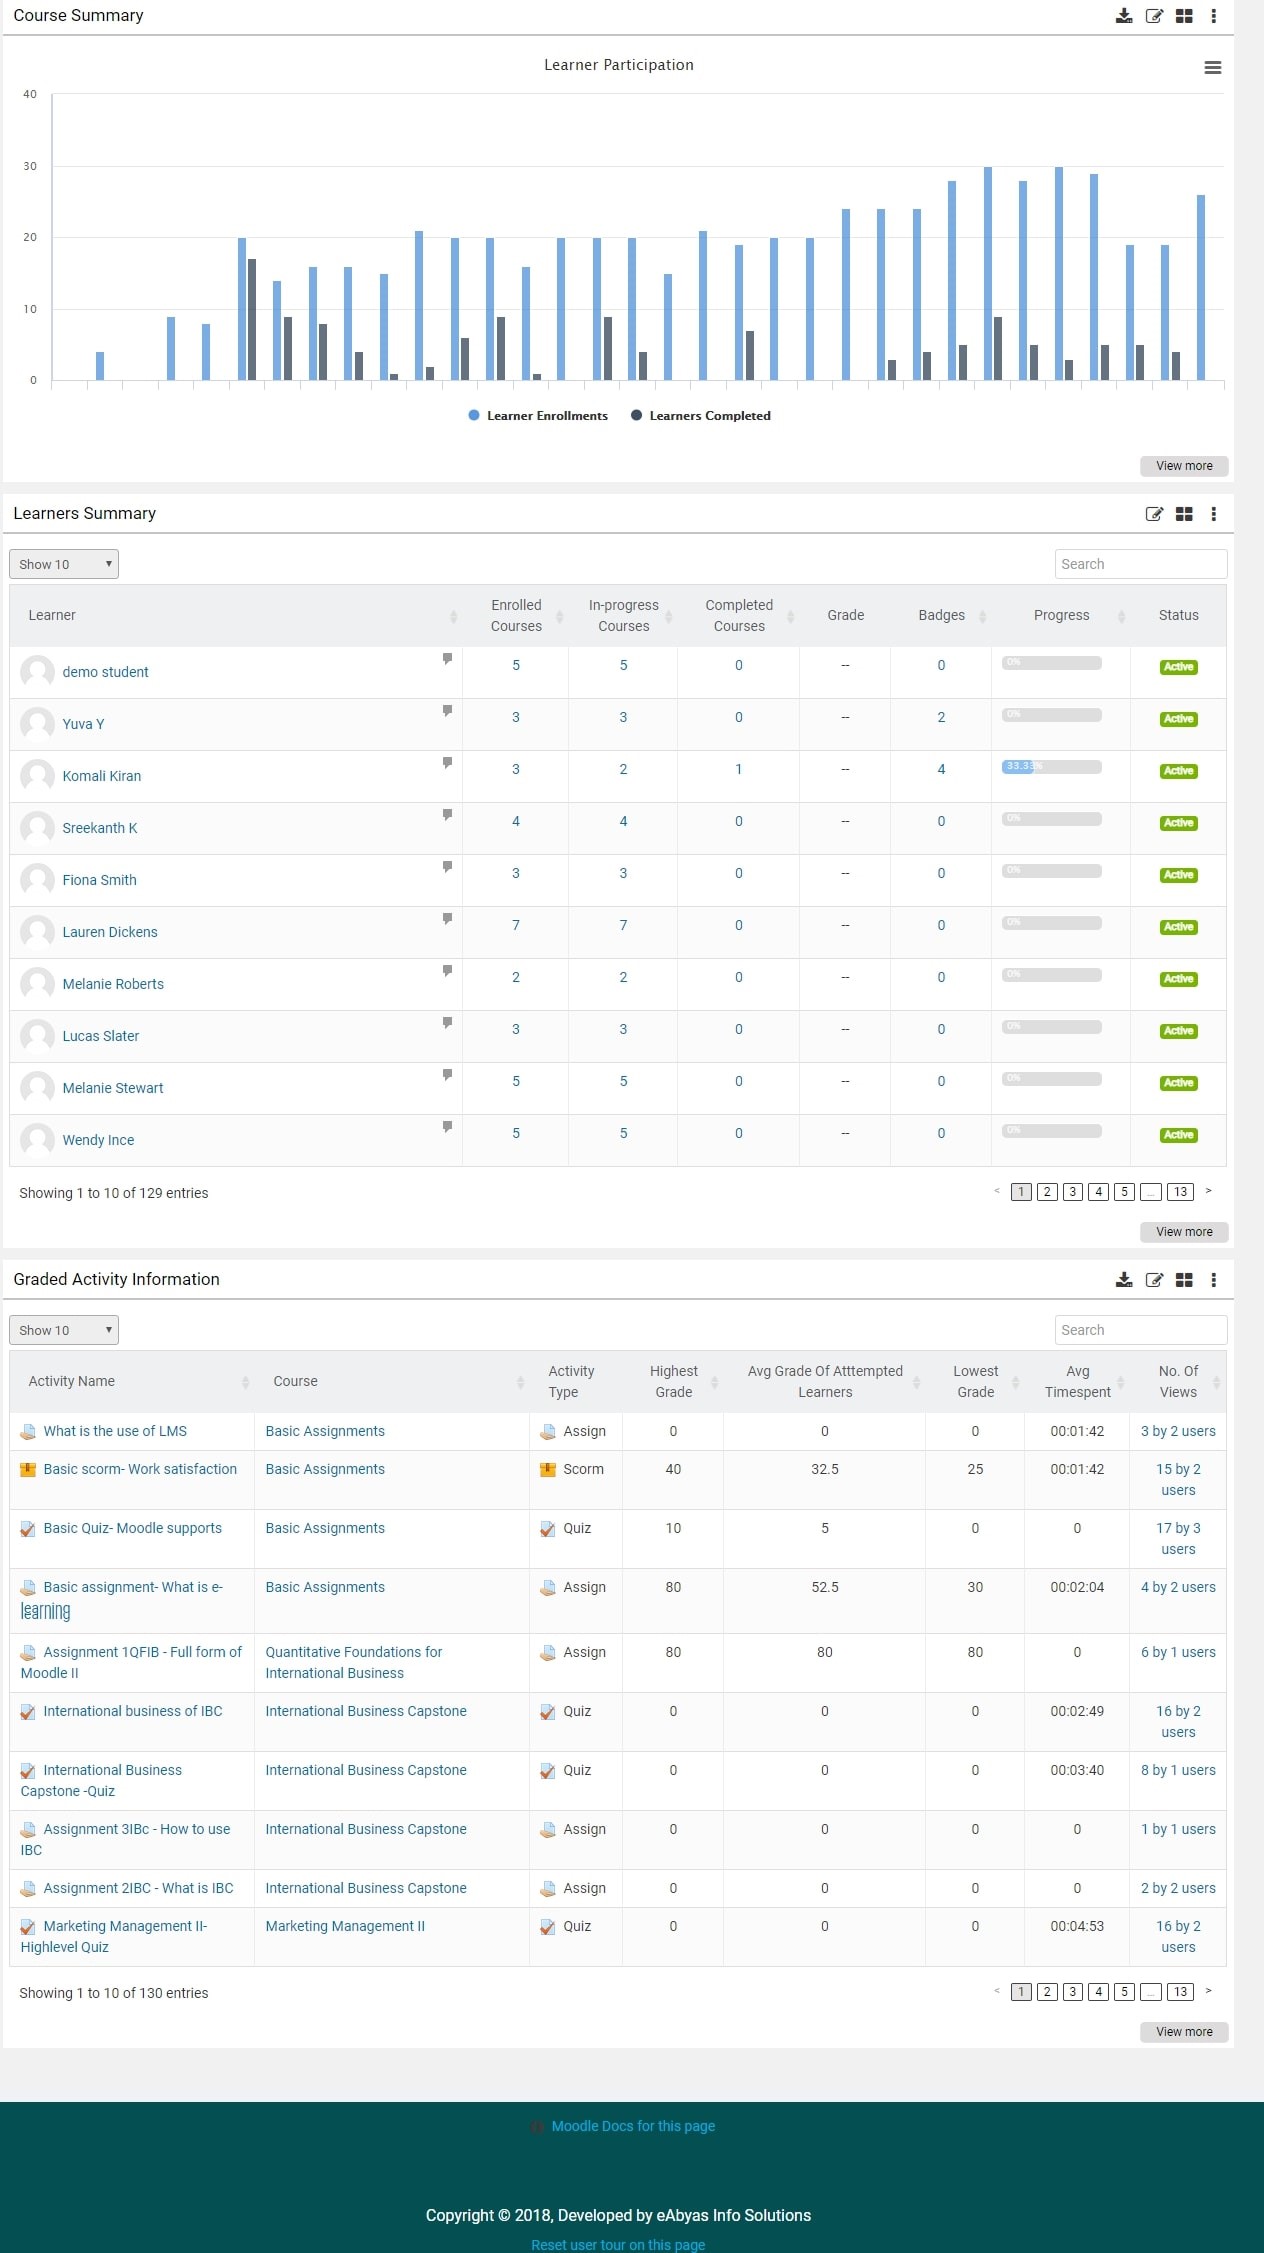
On the page there are many things to let you familiarize with. First let’s go with what you see at the top – Dashboard, LearnerScript and Dashboard (again, but it’s dynamic).
Dashboard and LearnerScript takes you to the one and the same page. Whenever manager switches dashboard from an action icon to his right, name for dashboard changes. For example, if she switches to Geographical, respective graphs and charts will be displayed on this dashboard.
Find some more action icons related to the whole dashboard to your top right.
Action icons like Add Widgets/Tiles, Add Report and Add New Dashboard are exclusive to manager role. However, the dashboards of teacher/instructor and student are devoid of them.
More about them …
- Switch Dashboard. Change dashboard to the required one like Geographical to Timeline.
- Add Widgets/Tiles. Can create a new widget or tile. While creating, she can choose what type of the report it is and where she wants it to position.
- Add Report. With this action, manager can add/create a Moodle report suitable to her requirements. She can use canned or create a new one. It all depends on requirement.
- Add New Dashboard. Name the new dashboard and save changes.
- Manage Reports. Against each report, its type and some actions icon are provided for further action.
- Switch Role. Manager can change his role. A default role will also be provided.
Each widget will have icons at the top right pertinent to it alone:
- Actions – Edit, Design, Delete and Hide
- Report – it’s specific to a widget. For example, one widget may have 4 to 5 related reports.
On top of them, download and menu options are provided for summery charts/reports.
Through menu, you can 1) Schedule 2) Send Emails 3) Filters a Moodle report for further drill-down of training data.
Teacher Role
For a teacher or student role, action icon access is limited to only three: such as,
a) Switch Dashboard
b) Report
c) Switch Role
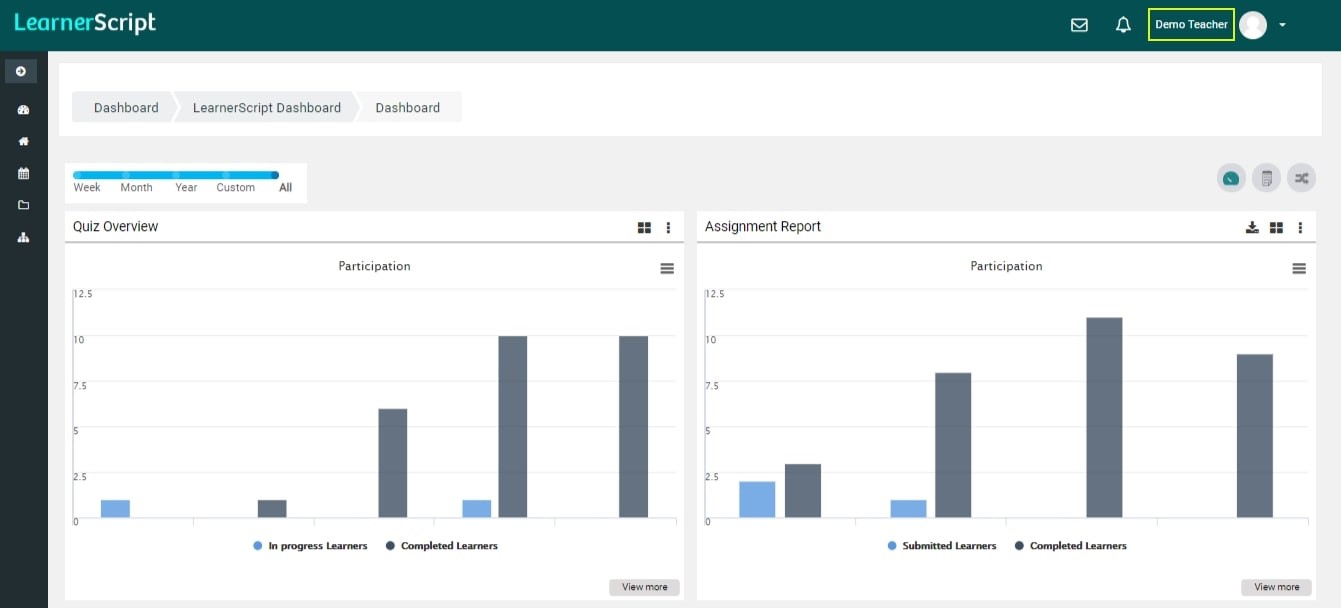
Just three. When you as the instructor/teacher browses through the options, you get all charts/graphs exclusively related to teacher role alone.
If manager/ Moodle admin shares any dashboard with the role, that will be displayed under Switch Dashboard. Besides, Report includes all activities of the role and those pertinent to this role. For example, assignments, leaner quizzes, etc.
Each widget for this role comes up with filters for easier and faster navigation.
Moreover, irrespective of the roles, widgets carry Chart Content Menu from which you can download the same in various formats. Ex: PNG, PDF, etc.
Student Role
Even for student/user role, there is no change in the dashboard icon options as mentioned above. She gets the same – Switch Dashboard, Reports and Switch Role. No difference.
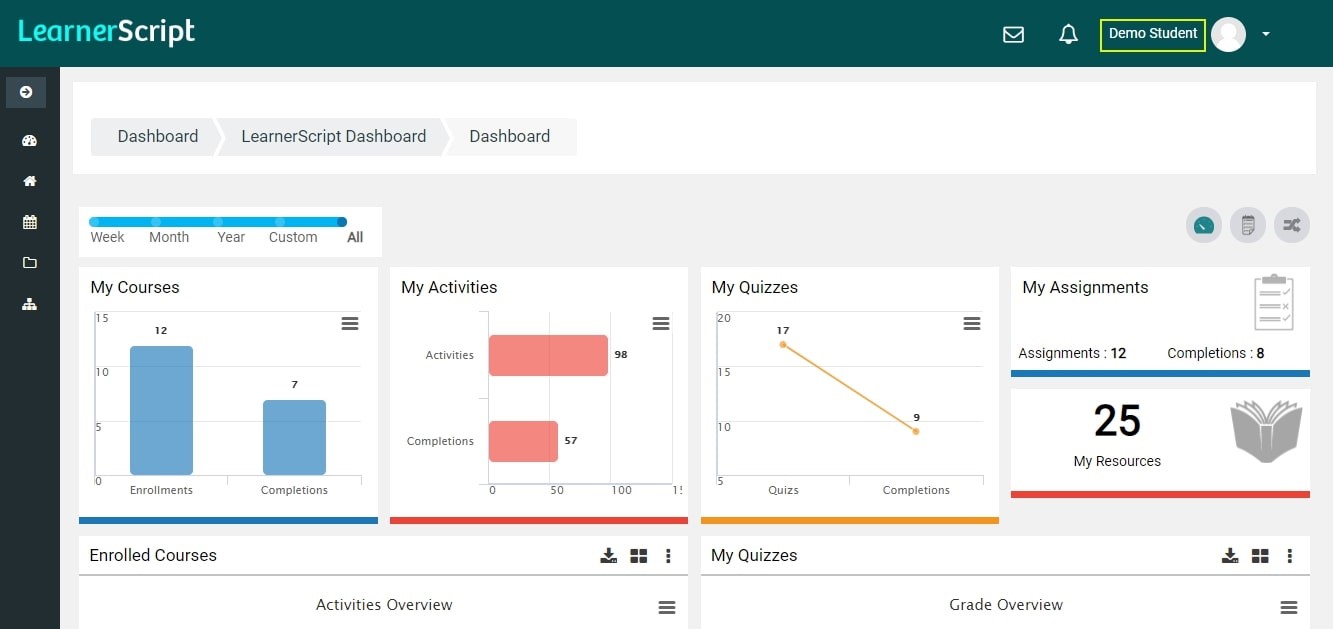
Here user can access reports such as enrolled courses, my quizzes, my assignments and my SCORMS, etc.
As mentioned earlier, for easier and faster navigation through the reports, she can use filters on Menu (filter symbol, at some places) of each widget. And right under the charts/reports, a student can see the badges she earned.
Timeline Reports
The beauty of LearnerScript is in timelining the reports, irrespective of the roles: as,
- Week
- Month
- Year
- Custom
- All
In custom, a role can see the Moodle reports summery for a specific period, other than that mentioned above. For the purpose, she has to enter the start and end date.
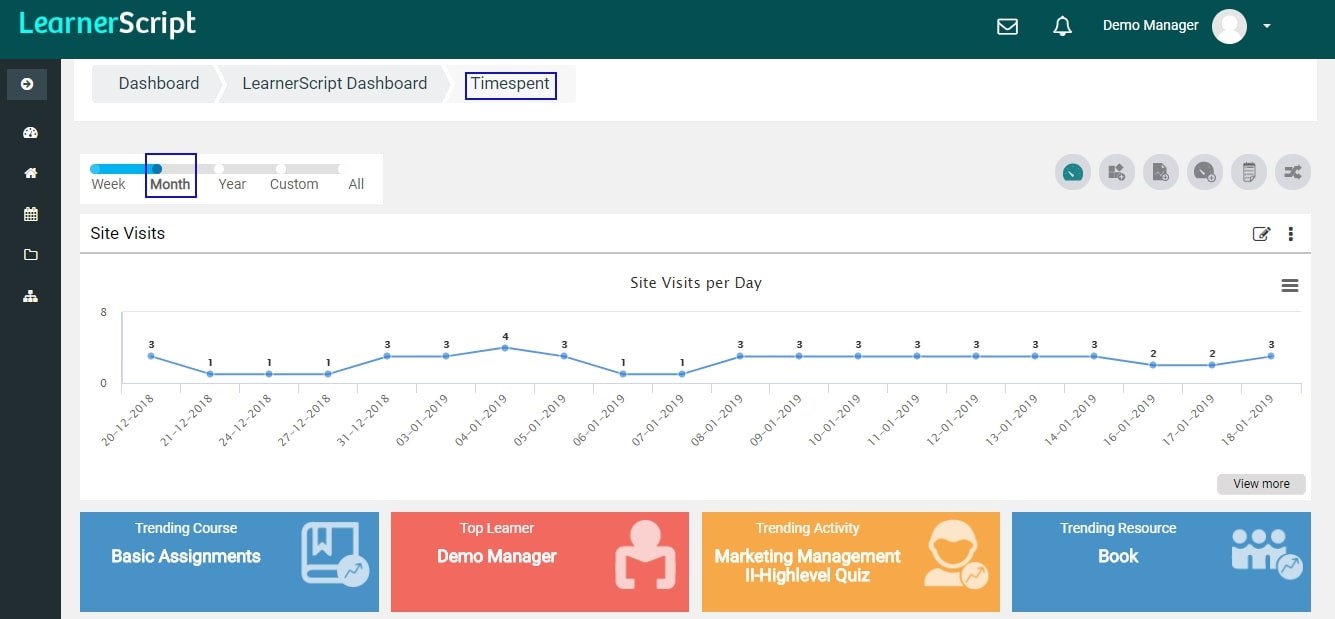
Ex: the image shows the timespent dashboard and one of the timeline reports over a month
In case the role wants to communicate with others, there is a letter icon over the header, next to the notification’s menu. A Moodle role can interact with the others.
Thus, you can get the feel of LearnerScript, familiarize with each aspect of this advanced analytics plugin. And know how different it is as you browse through the demo site.
Have any queries? Ask us right away.