The second version of LearnerScript, the Moodle analytics plugin, is released into the market now. And there is a lot in store for you from version 2. The version 2 from LearnerScript culminated out of the feedbacks from our valuable clients, interactions with Moodle admins and L&D decision-makers, expectations from teachers and managers, bug fixings and the improvements we wanted to include.
If you like to learn more about LearnerScript, a Moodle analytics tool from eAbyas Info Solutions, which is a Moodle Partner, follow this link. We bet you won’t regret following it!
Now, let’s see what’s new in the latest version of this plugin for the Open Source LMS.
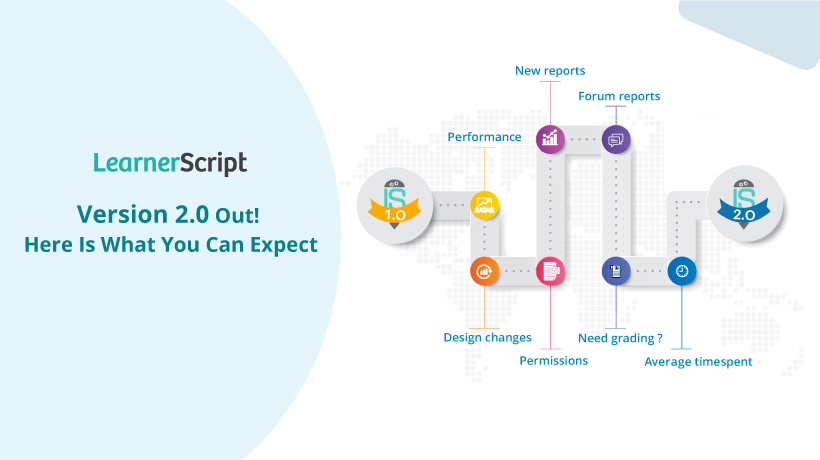
What You See in Version 2
Here is a list of changes in the second version of LearnerScript.
- Performance beyond expectations. Version 2 of LearnerScript drastically enhances performance in manifolds when compared to the initial version released last January. This upgrade is a booster.
- Combination graphs. The reason to include combo charts is to help get more insights in one report rather than making two reports and analyze them for insights. These charts go a long way for Moodle learning analytics. And the existing reports have been updated with better data points for insightful assessment. Earlier, there were only single graph reports.
- The new-look of Dashboards with context-wise reports. The dashboards look in version 2 has been completely changed to accommodate context-driven, specific reports. For example, the course dashboard. Instead of displaying the reports of the overall system, you will have a course-wise dashboard to a filter and select a course from the drop-down menu. This latest development is more engaging and insightful for any contextual role in Moodle. Notice the dashboard changes for teacher and student roles as well.
- Treemap report for system-level enrollments and completions. The latest update introduces a new report called Treemap. For example, you want to know the number of enrollments and subsequent completions overall the system in one glance. Then this report provides just that in one click.
- Forum activities and their report. Included forum activities report for your learners. You can see in the new forum report how many questions a learner asked, answered and spent time. Overall, you will learn whether she is an active or passive learner.
- Overall 85+ reports. In the first version, there were only 80 plus Canned Reports. Now, the reports increase to 95 plus. They cover all of your Moodle reporting needs; other than the reports you can create using LearnerScript.
- Report Permissions settings changed. Now, give a report permissions based on the context-level role your Moodle system.
- Teacher Specific Reports. In these 95 plus reports, there are Teacher specific reports. For example, a report shows how long a teacher not evaluated uploaded assignments, a report about how long a teacher not taken up a new course, and so on.
- Student Specific Reports. Like the teacher-specific reports, the Canned Reports include some more for students. For example, a report about due assignments and incomplete ones. The earlier version doesn’t have these reports.
- Average Time Spent by Teacher and Student. The new version includes a report to know the average and total time spent by teachers and learners on your Moodle LMS.
What else is left? Yea, there is more to know about the tool. Come and join us at one of our live webinars. And get this advanced Moodle analytics and reporting tool.
For those who do not know, LearnerScript is a Moodle analytics plugin designed and developed by a Moodle partner for the betterment of Moodle learning analytics. The cool thing about this product is it comes as One Time Purchase, but no exorbitant subscriptions.