Think of Michelangelo paintings. Think of Steve Jobs’ iPhone. What did you see from the designs? History tells us that a good design not only creates exceptional business but also causes a paradigm shift in benchmarks in all aspects.
Thomas Watson Sr, former IBM CEO in the first half of twentieth century, echoed the same thing, saying – good design is good business.
Design matters ultimately!
That’s what you’re going to see when you design Moodle reports on LearnerScript, a Moodle plugin for advanced analytics.
We’ve taken a cue from Jony Ive. Maybe you, too, next!
When it comes to designing Moodle reports, we’ve taken a cue from the celebrated iPhone designer, Jony Ive. We’ve followed minimalist principle. That is, with minimal clicks at a single page you , I or anyone (with the least knowledge of Moodle platform) for that matter can design Moodle reports on LearnerScript, with absolute ease. How come that be? Well, that’s certainly not a hyperbole. See it for yourself here.
Because you’re going to get it. We believe.
Nevertheless, the first thing that comes to your mind the moment you think of designing (hmm, probably anything) maybe this– ohh, it’s a herculean task. It requires,
- Thorough knowledge of the field
- Time consuming schedules
- Back-bending efforts
It certainly does. But we’ve dealt with all that herculean tasks to give you a cakewalk experience when you get started to design Moodle reports.
We report everything you do on Moodle
That’s how this Moodle plugin works. So, on LearnerScript, you can visualize all your Moodle analytics. For anything or for a specific reporting need you have. For example,
- Geographical userbase report
- Timespent (by your stake-holders) report
- Trending Course, etc.
You can create your own such Moodle reports on requirement – unlimited and useful reports for any role on Moodle LMS. Got it?
Witness the change in designing Moodle reports
On LearnerScript, you no need to worry about anything when it comes to designing Moodle reports. Everything is at your disposal. We’ve made this advanced analytics plugin in that way – to give an enriched Moodle experience in reporting Moodle analytics.
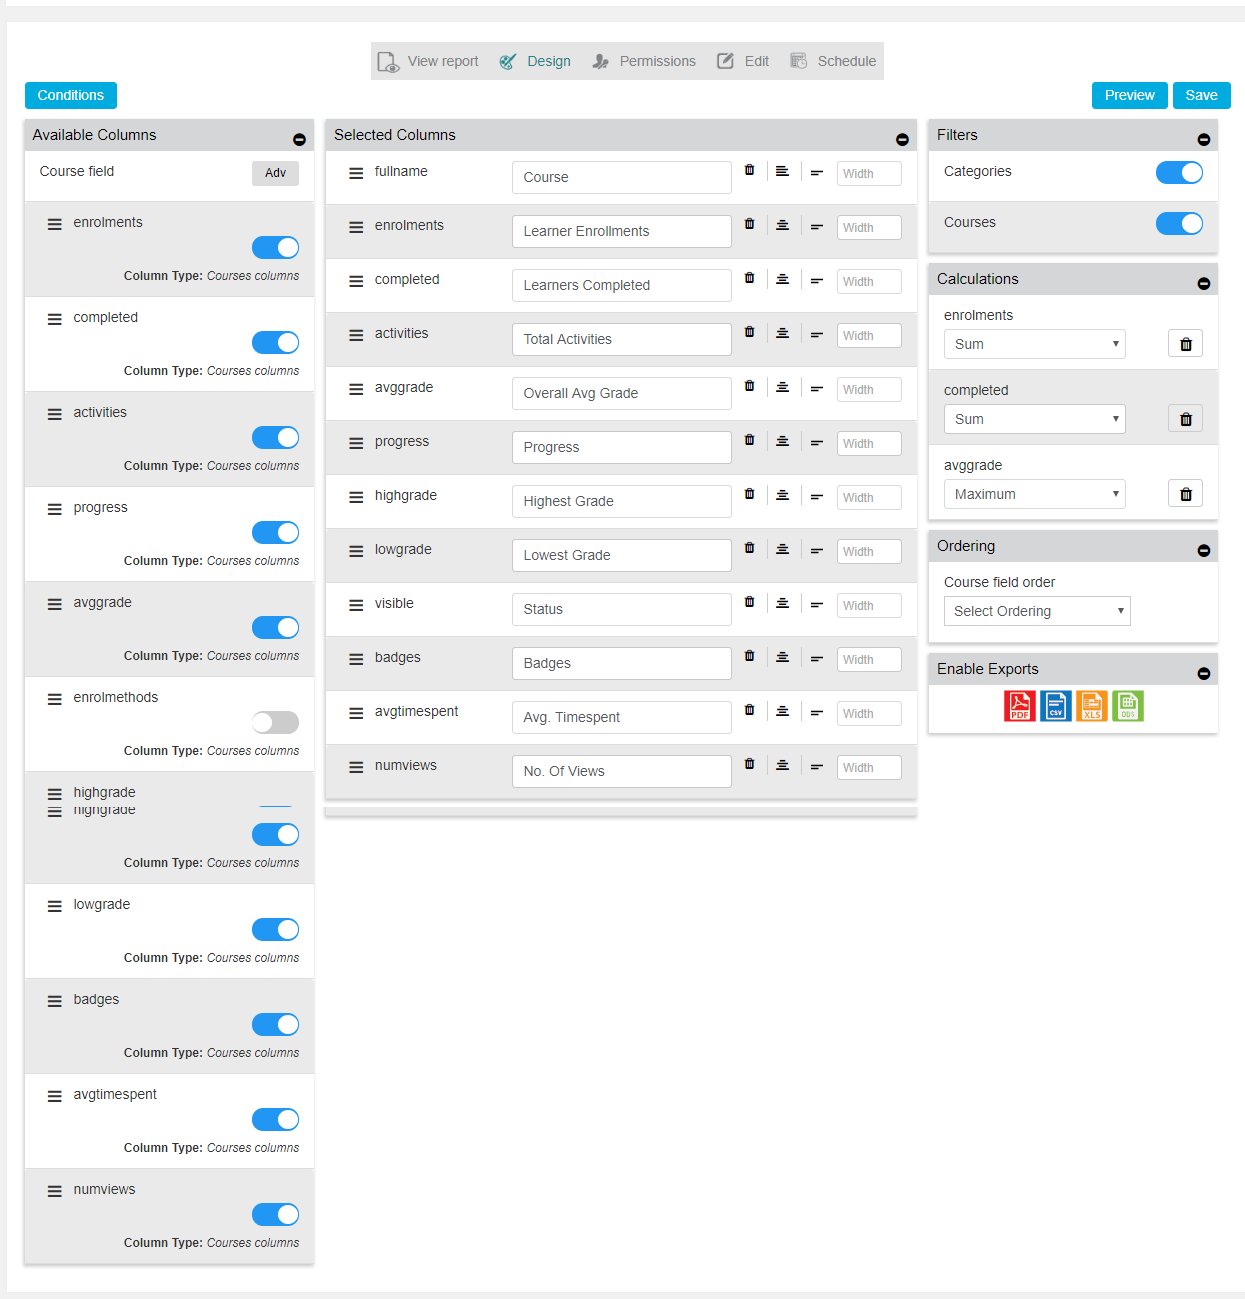
Take a look at the salient point listed below and try designing Moodle reports. Here we go,
- Select columns. To design Moodle reports, you need columns. Pre-defined datasets represent that columns. By choosing datasets, you say what the report is all about. On LearnerScript, you’ll find datasets for all most all components of Moodle – such as course, quiz and so on. Thus, you can design a report based-on your requirement. Based on your very need!
- Set filters. Enable filters while you are designing your Moodle reports. They will help you or your stake-holders for easy search.
- Showcase calculations. Here you can choose whatever calculations you want to show on the report.
- Support of drag & drop. While designing Moodle reports, you can use drag & drop facility for easy and quick designing.
- Single page work. That means, when designing Moodle reports you no need to move here and there. Or refresh anything to see your report progress. You’ll finish all the flawless designing work at a single page!
- See reports preview. Want to see how far you’ve succeeded in designing Moodle report? Whether you’ve got what you want to show in report or not? Hit the preview button there to see it.
- Save design. And finally hit the save tab to store the design of a Moodle report.
- Send reports through export. Enable export formats to send your Moodle reports to your stake-holders.
That’s all for now. To know more about Moodle reports plugin and to witness designing Moodle reports for yourself, visit us now and get LearnerScript